The price of SUPER has formed an ascending triangle near the $0.8397 resistance level after rising by 80%; the chart suggests a potential 31% breakout if this level is broken.
The digital asset SUPER has recently attracted attention with its sharp upward movement and notable chart pattern. Currently priced at $0.8328, SUPER has risen by 6.5% in the past 24 hours. The asset has also delivered an overall gain of 80% from previous levels. More importantly, the price is now approaching a clearly defined resistance zone at $0.8397. On the other hand, support remains stable at $0.7581.
This setup has led to the formation of an ascending triangle on the 8-hour chart. Based on previous movements and current structure, the chart indicates the potential for another bullish wave if a breakout occurs.
A Triangle Pattern Develops as Prices Consolidate Near Resistance
SUPER has been moving within an ascending triangle since early May. This pattern is characterized by higher lows and horizontal resistance. Price has tested the $0.8397 resistance multiple times without a decisive breakout. Meanwhile, the ascending support trendline has remained intact, reinforcing the pattern.
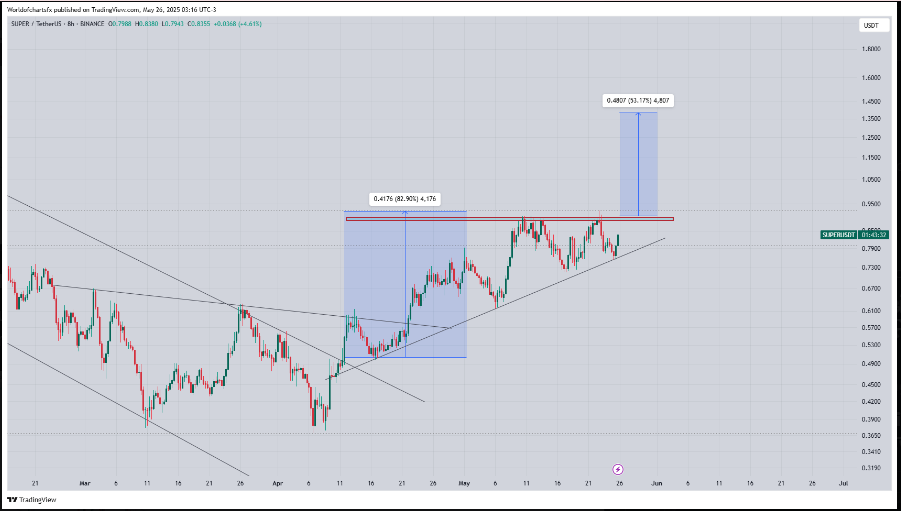
This pattern often signals the continuation of an existing trend. Traders are now closely watching whether a breakout above the horizontal resistance will occur. If confirmed, it could push the price toward the next projected level near $1.30, representing an additional gain of approximately 31.71%.
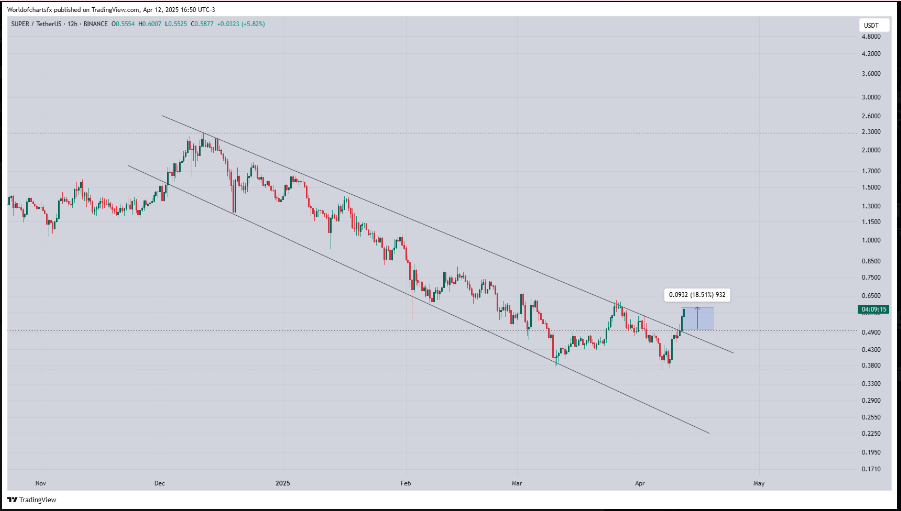
Previous Movement Highlights Measured Pattern Behavior
In early April, SUPER broke out of a similar technical formation. That move saw the price increase by 62.90%, gaining $0.4176 in value. This historical performance provides context for the current setup. The new triangle’s measured target, if matched proportionally, aligns with the $1.30 level. The prior pattern had a similar height and consolidation period, supporting current expectations. However, price action must confirm this move through sustained breakout volume and closing candles above resistance.
Volume, Resistance, and Market Context Drive Short-Term Expectations
Market participants are closely monitoring activity around the $0.8397 level. Volume remains a key factor in confirming a genuine breakout. Without a clear push above this zone, the ascending triangle could become invalid. The current 24-hour range shows tight trading behavior between support at $0.7581 and resistance at $0.8397.
This narrow range increases anticipation for a larger move. Any breakout will require confirmation to avoid false signals. As of now, the chart remains structurally sound, with buyers maintaining higher lows in each recent cycle.